The University of Calgary
Department of Geology and Geophysics, 2500 University Drive, NW, Calgary, AB T2N 1N4, Canada
pattersn@litho.ucalgary.ca cook@litho.ucalgary.ca
ABSTRACT
Key words: ground penetrating radar, complex signal analysis, gem pegmatites, mining.
INTRODUCTION
Gem bearing miarolitic cavities in rare metal, lithium enriched, granitic pegmatites pose challenging exploration targets, as they are not readily identifiable using normal geophysical methods of seismic, VLF, IP/TEM, magnetics, or gravity (Trueman and Cerný, 1982; Cook, 1997). Ground penetrating radar (GPR) has been shown to be a viable, non-invasive, geophysical technique for shallow, less than 50 m, subsurface surveys in snow, ice, glacial till, fluvial sediments, man-made concrete structures, and granitic rock environments, (Ulricksen, 1982; Davis and Annan, 1992; Patterson, 1996; Cook, 1997; Arcone, et. al., 1998). GPR surveys have also been proven useful in forensic and archaeological surveys, (Strongman, 1992). GPR further provides a unique possibility of being successful for hardrock mining of gem and mineral specimens under certain limited conditions (Patterson, 1996; Lees, 1998).
Successful interpretation of any geophysical data requires superb correlation with in-situ geological conditions. In petroleum seismology, many physical and structural features have been identified and generic models developed (Yilmaz, 1987; Cook, 1997). This effort is being extended into the realm of GPR as evidenced by the many papers presented at this and previous conferences and in the current literature. We have therefore undertaken a series of experimental programs to develop an understanding of pegmatite systems and the responses of GPR signals in these rocks. The test work was undertaken where scans were compared in various dike sections to determine operating characteristics and optimum recording parameters.
During the summer of 1998, over 400 meters of exposed pegmatite dikes were scanned and ground verified at the world famous Himalaya Mine, Mesa Grande, San Diego County, California. This gem pegmatite mine is located in the Cretaceous Peninsular Ranges Batholith about 100 kilometers northeast of the city of San Diego, (Foord, 1997). Although mined for over 100 years, this dike system is still productive, and gem cavities have been found using normal geological techniques as recently as two years ago. The hopes of the miners of finding missed pockets in the walls and pillars of the mine has been a dream of the mine owners for many years. The possibility of finding such pockets using GPR provided the impetus to allow our research team to use this mine as a test facility.
The scan that serves as the test bed for this study was selected due to its pristine quality and the fact that the observed anomaly was interpreted as a potential gem pocket in a section of the dike that gave no clear geological indications of pocket activity, (Figure 1). Subsequent ground verification, by physical measurements at each stage of excavation, proved this to be the first reported case of a gem tourmaline cavity identified by GPR, (Patterson and Cook, 1999). This scan was then processed with the RADAN data processing package from Geophysical Survey Systems, Inc., (GSSI), to determine which data processing concepts would prove most helpful for identifying potential targets.
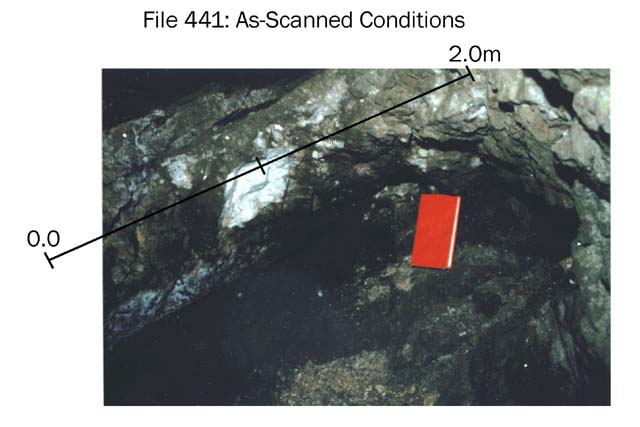
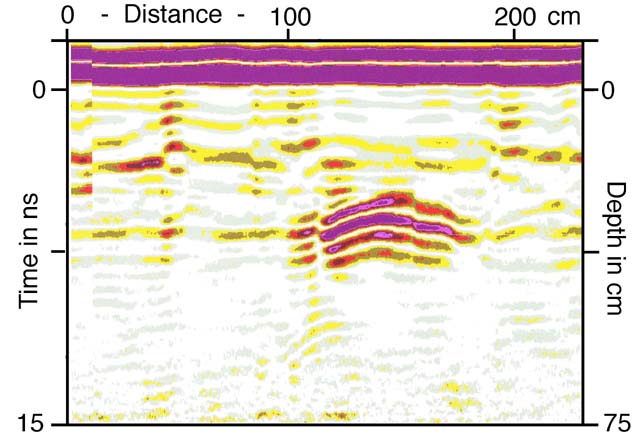
Figure 1: File 441 was recorded in a part of the dike that was no longer
actively mined. Here the dike exhibits few features that indicate gem cavity
formation. The high amplitude anomaly indicates the potential target.
METHODS and ANALYSIS
The data for File 441, (Figure 1) were collected on 6 June, 1998, using a GSSI, SIR II, with a 1,000 MHz antenna. Parameter selections to the scanning program are made via the fixed operating environment. The method of scan was based on a continuous profile, in which the antenna was held approximately 10 cm away from the face of the dike, and then moved in-plane parallel to the inclination of the dike, about 32° updip in this case. This allows irregularities in the surface of the dike to be absorbed by the air wave portion of the impulse signal. It also allows the signal to be directed into the most productive region of the dike. Although there is some signal loss using this method, over the method whereby the antenna maintains direct contact with the rock face, the reduction in false returns far outweighed any signal loss.
The velocity of the signal in air is 30 cm / ns, (GSSI, 1994). The working velocity of the signal in the pegmatite was estimated to be 10 cm / ns, based on a nominal dike dielectric value of 8 and previous experience in granitic pegmatites, (Patterson, 1996, Cook and Vasudevan, 1997). As the transmitting and receiving antenna are housed within the same shielded enclosure, a Zero Offset Section is recorded directly. Traces are stacked as they are recorded to increase the amplitude of anomalies and smooth the recorded information.
Our estimated maximum resolution and range of the
1,000 MHz antenna is 2 cm at 1 m distance in granitic pegmatites. Therefore,
a nominal 75 cm range was established, for a two way travel time of 15
ns. The impulse signal was set at 2 ns at a rate of 32 pulses per
second. Each 15 ns pulse train was sampled at discrete 8 bit, 512
spaced intervals, Vertical High Pass Filter = 250 MHz, Vertical Low Pass
Filter = 2000 MHz, Horizontal Smoothing = 4 scans, and a transmit rate
of 64 KHz. The recording gains were set automatically at 4 points, by the
system, based on an internal algorithm and a returned test signal established
during the setup portion prior to the scanning session (GSSI, 1994).
The traverse rate was established, by practice of the operator, at approximately
20 cm per second. The most important operator condition of each scan
was to traverse the surface at a constant rate, at nearly a constant separation,
and not to halt the traverse or touch the rock face. Marker lines were
added during the scan at pre-measured points and at the pre-determined
turn-around point. In this way a monitored symmetry could be observed on
each scanned section.
The recorded scan was played back immediately for real time interpretation.
The only signal processing available at playback time was re-mapping of
the amplitude of the signal to different color schemes and scales,
(i.e., square root, logarithmic, power, etc.). We chose to image
the scan using the variable density plot, with a linear color scale giving
a black background with red positive and white negative amplitude images.
A wiggle trace and single trace mode can also be displayed. We felt
that the variable density image provided the optimum information in this
underground mining situation.
Upon returning from the field, the data were transferred to a Compaq IBM-PC 486 notebook with 48 MB RAM and 1 GB of hard disk, running under Windows 95. The data are recorded in the GSSI *.DZT format. The data was read directly into the RADAN for Windows data processing software package for signal processing and manipulation. RADAN supports simple numerical calculations, trace editing, bandpass and FK filtering, Spiking Predictive Lag Deconvolution, Hyperbolic and Kirkhoff Migration, and Complex Signal Trace analysis using the Hilbert Transform, (GSSI, 1995).
RESULTS and DISCUSSION
In the raw data scan shown on Figure 1, the colors have been changed for a more appropriate print display. Otherwise, all of the features, amplitude ranges, and scales have been preserved. The initial observation of a curvilinear anomaly approximately 40 cm in length and 2.2 ns in two way depth is essentially as observed at the time of the scan. The surprisingly large amplitude and definite character of the anomaly led directly to an interpretation of a possible pocket. Inspection of the pegmatite showed a small, 3 cm dia., alteration zone at the dike lower contact with the host gabbro-norite. This alteration zone proved to be fractured, and fell apart upon probing with a finger. At this time, a gem tourmaline crystal fragment fell out! The unique aspect of this cavity was that it was air filled, rather than red or white clay filled as described by Foord, (1977). The lining of the cavity was moist, and measurement of the excavated pocket showed it to be within 1 cm in length and 1 cm in depth of the interpreted distances, (43 cm x 12.5 cm). Perhaps the lack of red clay alteration in this segment of the dike created a condition whereby the signal return was not attenuated by the clay, which is the typical case.
Taner, et. al., (1979), demonstrated the effectiveness of complex signal analysis on seismic traces. As RADAN supports this method through the application of the Hilbert Transform, we applied the magnitude feature to the raw dataset as shown on Figure 2. The image of the anomaly improved in definition, the resulting form proved to be quite promising. Based on this a complete Hilbert Transform series was performed on the dataset. The frequency plot, Figure 3, provided new information with respect to a distinct shift in frequency, similar in color to the air wave, although this color shift is slightly buried in the background noise band.
The phase plot, Figure 4, provided the most significant new information for our interpretation. Starting at about 1.1m along the line of scan, a sharp and discrete change in phase demarked the location of the start of the anomaly. A similar sharp change marked the end of the anomaly. When the magnitude plot, Figure 2, is overlain by the phase plot, Figure 4, a clearer image of the change in signal becomes readily apparent. From this we interpret that the change in dielectric property from granite to air is marked by a significant phase change that can be easily identified for enhancement of the interpretation. This processing step was applied to all of the analyzed scans and compared successfully to the excavated portions of the dike.
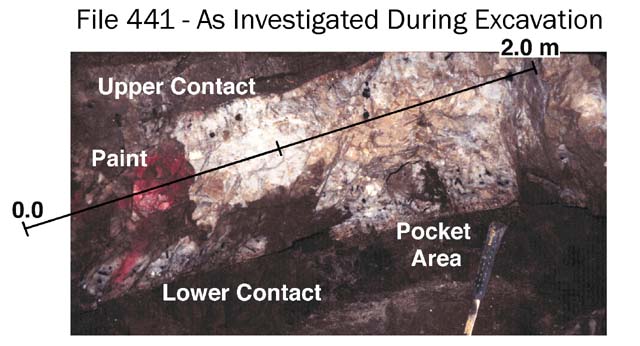
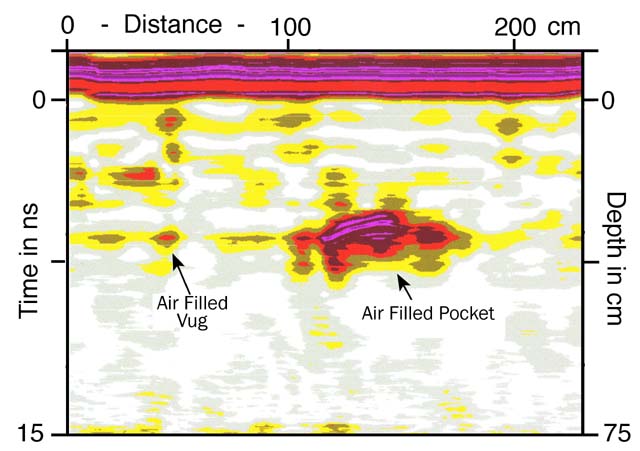
Figure 2: Scan processed with a Hilbert Transform for magnitude. Red
paint spot locates the site of the air filled vug that contained one small
tourmaline crystal.
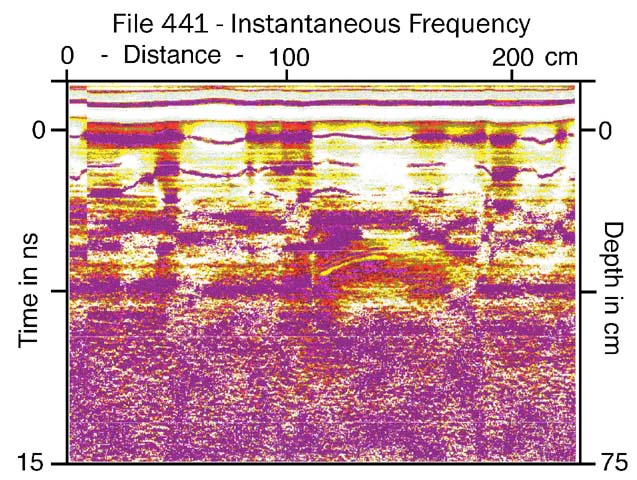
Figure 3: Frequency change is seen as a thin yellow band.
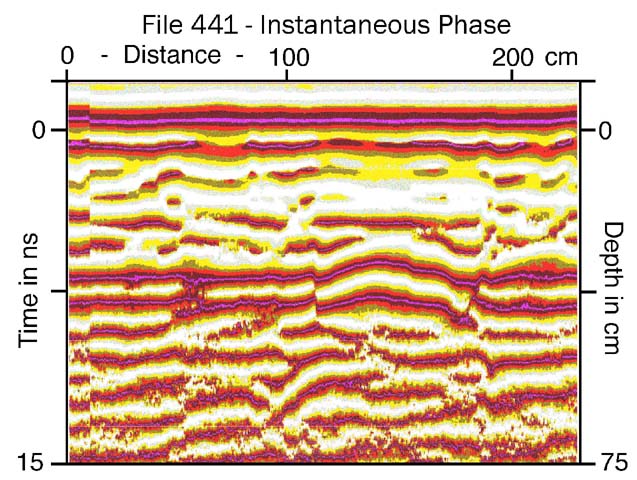
Figure 4: Phase change is seen by the sharp demarcations.
The final processing step was to apply a Kirkhoff Migration, with the relative velocity set to 1, prior to applying the Hilbert Transform. This step effectively muted the objectionable surface pulse and reflection, smoothed the traces, and created a more cohesive image of the anomaly. A printed plot of each potential target anomaly was then given to the miners as a map of the subsurface for the purpose of establishing a drill, blast, and excavation pattern.
CONCLUSION
Under the conditions scanned at the Himalaya Dike
system, it appears that complex signal processing, as presented by the
Hilbert Transform for magnitude and instantaneous phase provides significant
additional information for target identification. All of the other procedures,
like deconvolution and bandpass filtering did little to improve the quality
of the already clean dataset. The Hilbert Transform for Magnitude provides
a more cohesive image of otherwise ringing anomalies and is a very straightforward
and simple data processing step. It is suggested that it be programmed
directly into the scanning software package and made available during the
playback stage for real time interpretation.
After the anomaly was completely excavated and cleaned, the SIR-II
was brought back to the site, on 8 July, 1998, and the area of File 441
re-scanned using a 900 MHz antenna set to 30 ns two way travel time, for
an approximate depth of 1.5 m. This scan, Figure 5, clearly shows
that the region of the anomaly no longer provides a significant return.
The complete lack of signal return of the remaining portion of the pocket
at file 441 is unknown at this time. It is speculated that the piezo-electric
effect of the gem tourmalines may have actually provided the high amplitude
return on the original scan, rather than just the closed pocket cavity.
By applying this complex signal analysis uniformly across all of the scanned sections of pegmatite, we were able to identify an additional 7 major gem bearing pockets and 25 gem bearing vugs, with 100% accuracy. These interpretations included pockets filled with signal attenuating wet red clays. To further verify our findings, we excavated 10 additional anomalies that were predicted to contain either no gem material, completely frozen material or simply barren dike. Our excavations verified the accuracy of our interpretations. We feel that the efficacy of this technique proves it to be an economically viable geophysical method, under the conditions experienced at the Himalaya Mine dike system.
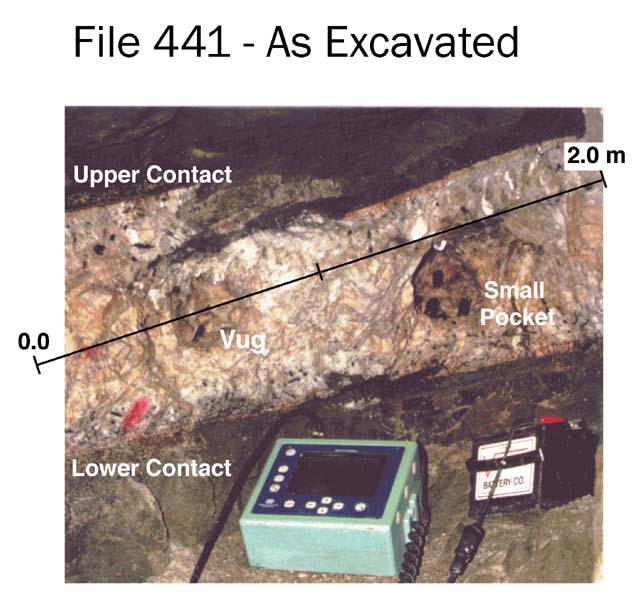
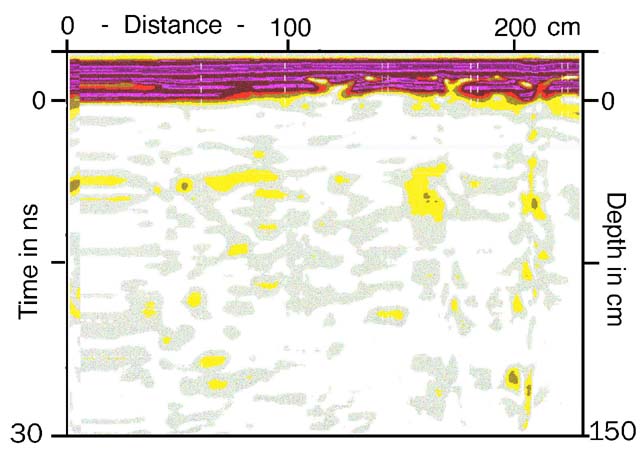
Figure 5: Post excavation scan shows no remaining anomalies. This could
be caused by the removal of the piezo-electric tourmalines or the opening
of the cavities. The GSSI, SIR-II, and discovered tourmalines are shown
in the photograph for scale and clarity of this work.
ACKNOWLEDGMENTS
Supported by the Canadian Natural Sciences and Engineering
Research Council. We owe a particular debt to the late Eugene E.
Foord for his many helpful discussions. We thank the mine owners
at Pala International for allowing us access; Dan DeLea at GSSI for providing
the processing software (RADAN); Kris Vasudevan and Gary Margrave for discussions
on signal processing; Bob Scarborough for assisting with organization and
fieldwork; and Benjamin Castillo, Jim Means, Jeffrey Krogstad, and Mike
Menzies for providing capable assistance in the excavation.
REFERENCES
Arcone, S.A., Lawson, D.E., Delaney, A.J., Strasser,
J.C., and Strasser, J.D., 1998, Ground-Penetrating radar reflection profiling
of groundwater and bedrock in an area of discontinuous permafrost, Geophysics,
63, 5, 1573-1584.
Cook, F.A., 1997, Applications of Geophysics in Gemstone
Exploration, Gems & Gemology, 33, 1, 4-23
Cook, F. and Vasudevan, K., 1997, Georadar anisotropy
in the Gotthard gneiss, Switzerland, Geophysical Research Letters, v. 24,
p. 197-200. .
Davis, J.L., and Annan, A.P. 1992, Applications of ground
penetrating radar to mining, groundwater, and geotechnical projects: selected
case histories, in, Ground Penetrating Radar, J. Pilon, ed., Geological
Survey of Canada, Paper 90-4, 49-55.
Foord, E.E., 1977, The Himalaya Dike System, Mesa Grande
District, San Diego County, California, Mineralogical Record, 8, 461-474.
Geophysical Survey Systems Inc., 1994, SIR - II Operation
Manual, Geophysical Survey Systems, Inc., North Salem, New Hampshire, Manual
#MN72-140.
Geophysical Survey Systems Inc., 1995, RADAN for Windows,
Beta Version 1.4, Geophysical Survey Systems, Inc., North
Salem, New Hampshire, Manual #MN43-116.
Lees, B.K., 1998, The Application of Ground-Penetrating
Radar to Mineral Specimen Mining, Mineralogical Record, 29, # 2, 50 &
145-153.
Patterson, J.E., 1996, Modeling of Layered Aplitic Pegmatite
Dikes Using Ground Penetrating Radar, Little Three Mine, Ramona District,
San Diego County, California, The Spirit of Inquiry, University of Arizona
Undergraduate Research Program, 17.
Patterson, J.E., and Cook, F.A., 1999, Successful Application
of Ground Penetrating Radar in Exploration for Gem Tourmaline, (abstract),
Canadian Mineralogist, v. 37, 862-863.
Taner, M.T., Koehler, F., and Sheriff, R.E., 1979, Complex
seismic trace analysis, Geophysics, 44, 6, 1041-1063.
Trueman, D.L., and Cerný, P., 1982, Exploration
for Rare-Element Granitic Pegmatites, in Granitic pegmatites in science
and industry, P. Cerný, ed., Mineralogical Association of Canada
Short Course Handbook, 8, 463-494.
Strongman, K.B., 1992, Forensic applications of ground
penetrating radar, in, Ground Penetrating Radar, J. Pilon, ed., Geological
Survey of Canada, Paper 90-4, 203-211.
Ulricksen, C.P., 1982, Application of Impulse Radar to
Civil Engineering, Ph.D. Thesis, Lund University of Technology, Lund, Sweden,
175 pp.
Yilmaz, O., 1987, Seismic Data Processing, Society of
Exploration Geophysicists, Tulsa, Oklahoma, 526 pp.